Exploring the Fluid Dynamics of an Electric Short TakeOff and Landing (eSTOL) Aircraft (Part 3 of 3)
In this third and final installment, we present the results obtained from our extensive parameter study of an eSTOL aircraft using computational fluid dynamics. As we have mentioned in the previous articles, it is useful to study the individual components of an eSTOL aircraft to get a better understanding of the fluid dynamics involved.
Be sure to check out PART I of the series to get a better understanding of why such a study is important and PART II to learn about how we go about modeling an eSTOL aircraft using computational fluid dynamics.
PART III
(Approximate reading time: 15mins)
Isolated Rotor
An isolated rotor consists of a central housing unit containing the electric motor and the propeller system attached to it. We study three main parameters in this setup. The general flow velocity away from the rotor (called “freestream”), the angle of attack of the flow approaching the rotor, and the propeller rotation speed. The analyzed parameters are the following:
| α (°) | [0, 10] |
| RPM | 4000 |
| V∞ (m/s) | [6.12, 9.53, 14.97, 20.08, 28.58, 47.64] |
One of the main design considerations of a rotor is how much thrust it can provide to the aircraft. In Figure 1, we show the total rotor thrust for different setups.
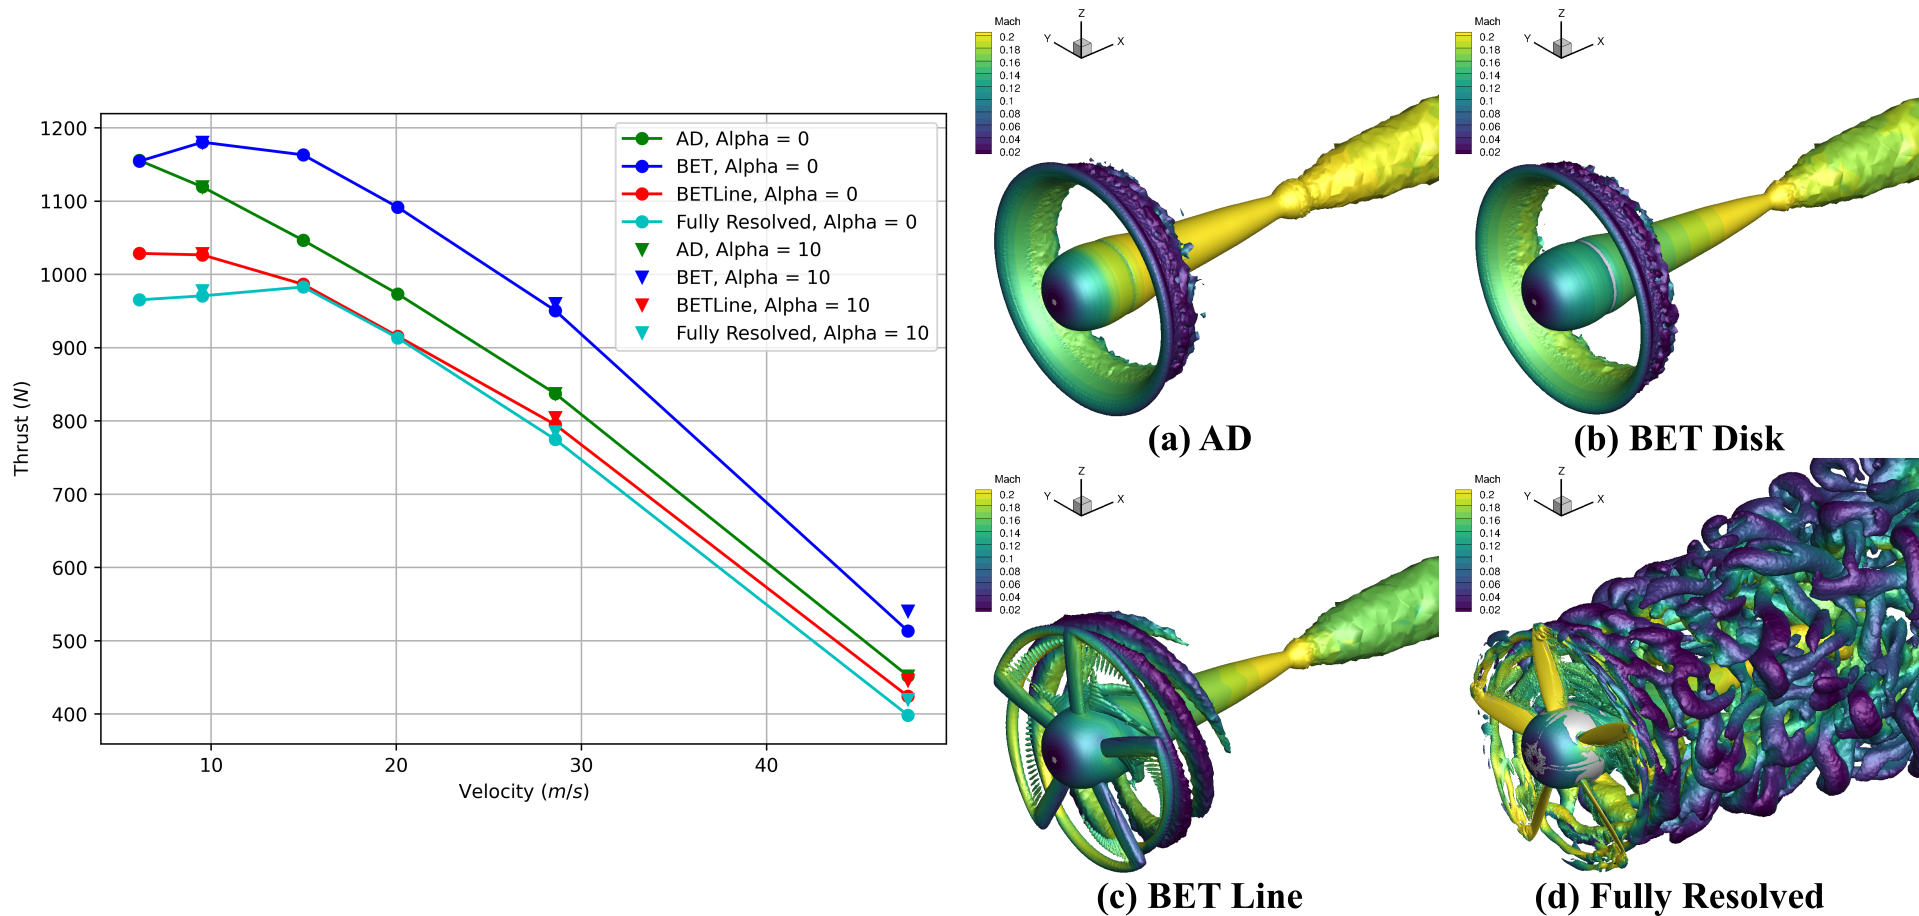
As we can see from the data, the angle of attack (“Alpha”) of the flow approaching the rotor has essentially no effect on the rotor thrust when the angle changes from 0° to 10° since the inverted triangle data points are almost overlapping with the data shown by filled circles. The main factors that change the thrust are the different propulsion approximations. Since both FR and BET Line resolve the individual blade dynamics they get very similar results (compare cyan and red). Also, notice the similar blade tip flow structures in the bottom two right panels in Figure 1. These comparable results are encouraging since the cost of simulating the BET Line model is significantly lower than the FR model.
The other two approximations, AD and BET Disk, differ significantly from the FR approach, with 25% being the maximum difference. The instantaneous flow structures are very different in these two compared to the FR and BET Line models. This was expected given the modeling approximations.
Rotor Interactions with a Wing and Flap
Let us now investigate how a rotor might interact with an attached wing and a highly tilted flap – a very useful configuration for studying takeoff and landing of an eSTOL aircraft. Since we are performing a computational study, we can imagine and answer some hypothetical questions. For instance, does a pylon or the center housing body of the rotor significantly affect the overall rotor-wing-flap fluid dynamics? Is the design of these two components very important? We use the BET Disk propulsion approximation here, which, as we learned from our isolated rotor case above, is a good compromise between the AD and the FR approaches. It turns out that the presence of the center body and pylon significantly alters the flow dynamics.
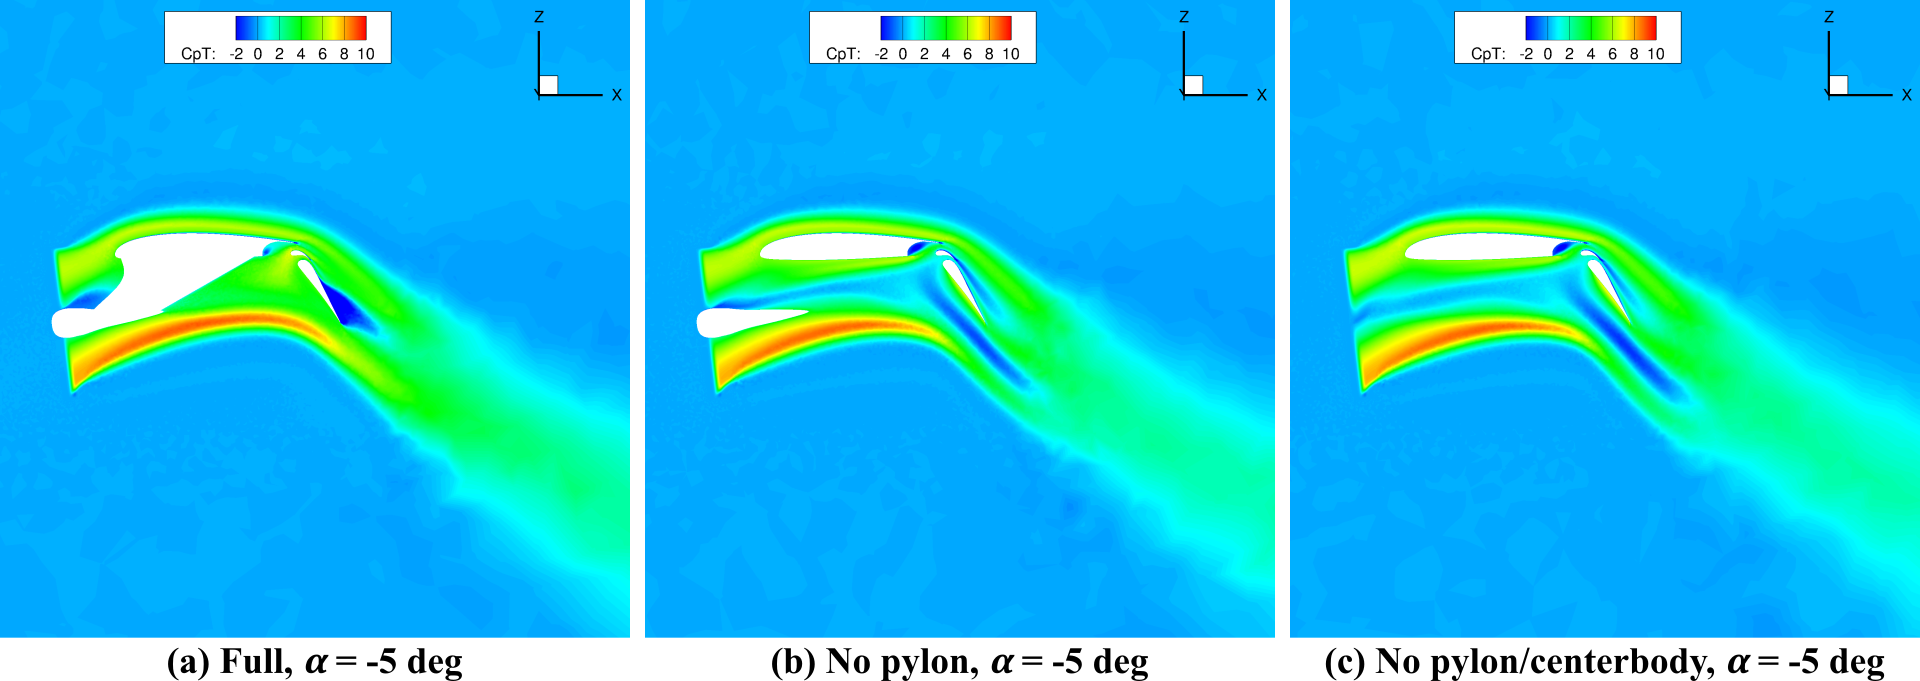
We show the distribution of the total pressure coefficient in Figure 2. Note here that we use an alpha of -5°, which is a bit unusual but is justified in such a simplified configuration. This is because the ratio of lift coefficient to aspect ratio, which dominates lifting-line theory, is very high. The figures show that the rotor effectively has a positive angle of attack due to the strong upwash generated by the wing.
In the leftmost panel, the dark blue region present on the suction side of the flap shows a low total-pressure region, indicating a locally separated flow. The other two setups on the right completely lack this behavior. Therefore, we can conclude that it is important to include the center body of the rotor as well as the pylon to properly model the fluid dynamics of the rotor-wing-flap system.
Different Propulsion Models
It is also useful to study how the different propulsion models discussed above will behave in a rotor-wing-flap system containing the center body and the pylon. In Figure 3, we again plot the total pressure coefficient but for different propulsion models.

The AD and BET Disk show a low-total-pressure detachment of the flow on the trailing edge of the flap while it is not present in the BET Line and FR cases. This may be related to the mixing caused by the tip vortices, which are evident in the figures. Based on this and other diagnostic measures we analyzed, it is clear to us that there is a substantial variation in the fluid dynamics induced by the different propulsion models when we consider a more complex setup containing a rotor, a pylon, a wing, and a flap.
Case of the Full eSTOL Model
We now turn to the most complete setup where we include an aircraft fuselage, a primary finite-sized wing, four fully-interacting rotor systems, and two control surfaces (an inboard flap and an outboard aileron). In terms of the complexity of the fluid dynamics involved, this setup would be closest to the actual aircraft geometry.
Note that we only consider the left side of the aircraft since it is reasonable to assume that the fluid dynamics are symmetric between the left and the right side of this aircraft. Due to the larger computational cost of this setup, the number of configurations we could explore was much more limited compared to the earlier more-idealized setups. Furthermore, we utilize only the AD, BET Disk, and BET Line propulsion models for the 3D setup.
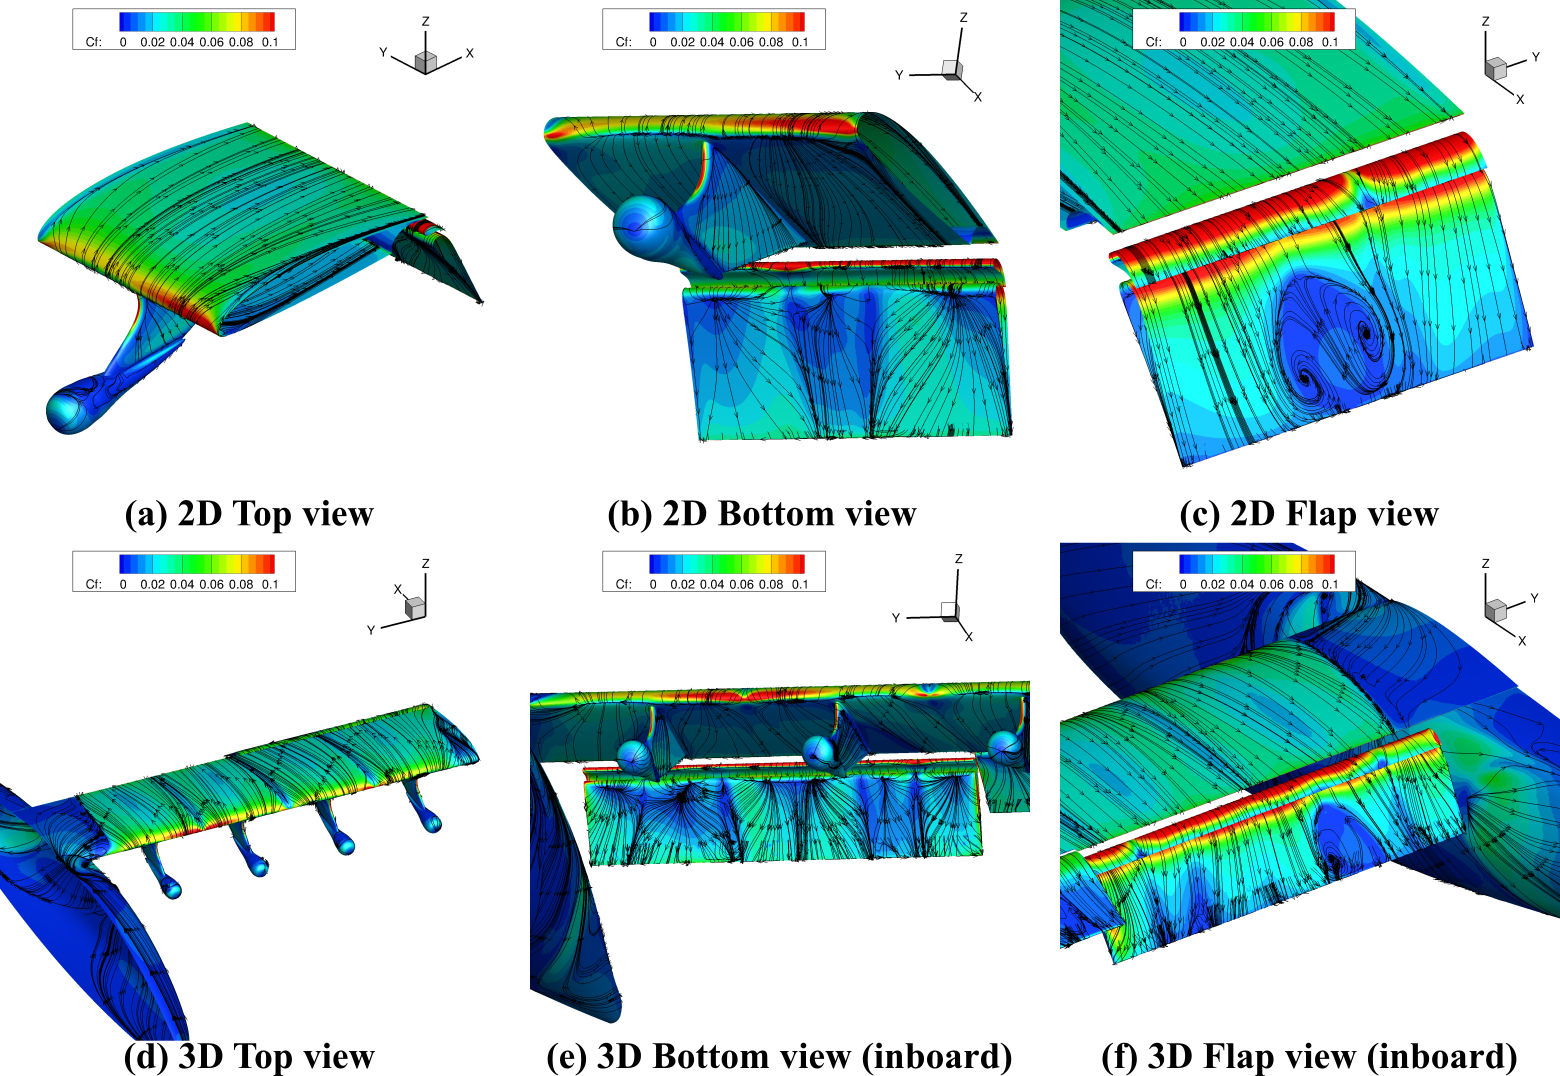
In Figure 4, we visualize the flow streamlines on the aircraft surfaces as well as the skin friction coefficient of an idealized 2D setup (top row) and a 3D setup (bottom row) for similar control surface parameters. The BET Disk approximation is used for both cases. A similar streamline profile on various surfaces as well as a similar magnitude of the skin friction coefficients tell us that the fluid dynamics are generally similar between the idealized 2D setup and the full 3D setup. However, the total lift coefficient was significantly lower in the 3D case as compared to the 2D case. This is likely due to the interaction of the fluid flow from the adjacent rotors, the added complexity from the two control surfaces at different inclinations, and the fuselage which is absent in the 2D case. Therefore, although the compartmentalized 2D model setups are quite useful in capturing some of the relevant fluid dynamic behaviors, a full 3D model is certainly needed to provide some important insights into the overall flight performance.
Computational Costs of the Various Models
The table below shows the computational costs associated with the different setups as well as the different propulsion models we studied.
| AD & BET Disk | BET Line | Fully Resolved | |
|---|---|---|---|
| Isolated Propeller | 1 | 6-12 | 40-60 |
| 2D Model Problem | 3-4 | 80 | 280 |
| 3D Aircraft | 25 | 320 | - |
For an isolated propeller setup, modeling BET Line and fully resolved cases are generally more than an order of magnitude more expensive than the AD or BET Disk models. Furthermore, modeling a rotor-wing-flap setup in a BET Disk approach is cheaper to simulate by a factor of about five as compared to the full 3D setup. We can see that a judicious choice of modeling technique can lead to tremendous savings in terms of the computational cost of simulating a model.
Summary
Based on the numerous simulations we carried out, several conclusions emerge. Since it is cost-effective yet still captures important aspects of fully resolved simulations, we can infer that BET Disk is a very useful approach for modeling the propulsion system. Furthermore, studying an isolated rotor-wing system provides very important insights at a much-reduced computational cost. Additionally, our simulations show that it is important to include the centerbody of the rotor and the pylon to accurately model the interaction of the rotor with the inclined flaps.
The fluid dynamics around an eSTOL aircraft is clearly very complex and it certainly involves the interaction among many parts of the aircraft. But, as we have shown above, we can perform a rapid performance analysis of the aircraft design by using substantially simplified models. This is a crucial strength in this arena where new design strategies and rapid prototyping are paramount for developing efficient and well-functioning eSTOL aircraft.
This concludes our series of articles on modeling an eSTOL aircraft using computational fluid dynamics.
If you’d like to learn more about CFD simulations, how to optimize them, or how to reduce your simulation time from weeks or days to hours or minutes, stop by our website at Flexcompute.com or follow us on LinkedIn.
For the expanded version of the paper this content is derived from, see Impact of the Propulsion Modeling Approach on High-Lift Force Predictions of Propeller-Blown Wings.
