CFD Simulation Methods for High-Lift Aircraft Configurations (Part 2 of 3)
In this series we will highlight contributions to the 4th AIAA High Lift Prediction Workshop using a variety of CFD simulation techniques. The full series consists of three parts: Part I provides essential background motivation for carrying out this study. Part II will detail our modeling strategy and discuss the computational fluid dynamics approach. Part III will showcase the results and how they are useful in enhancing our understanding of flow behavior in high-lift configurations.
PART II – Simulation Sensitivities
In PART I of this series, we discussed the motivation behind developing a robust and accurate CFD framework for simulating the fluid dynamics of an airplane wing in high-lift conditions. In this 2nd part of the series we discuss in detail what kind of tools and techniques we use for modeling a representative airplane using CFD.
Flow360 Solver
Flexcompute has developed the Flow360 solver – based on hardware/software co-design with emerging hardware computing – providing unprecedented solver speed without sacrifices in accuracy. The Flow360 solver is a fully compressible node-centered unstructured grid Navier-Stokes solver based on a 2nd order finite volume method.
Flow360 includes a number of turbulence models including the “-neg” version and “-RC” extension of the Spalart-Allmaras (SA) model, the k−ω shear stress transport (SST) model, as well as the Detached Eddy Simulation (DES) model. Transition modeling capabilities are also available based on the 3-equation Amplification Factor Transport (AFT) model of Coder, but are not used in the present work.
Simulated Conditions
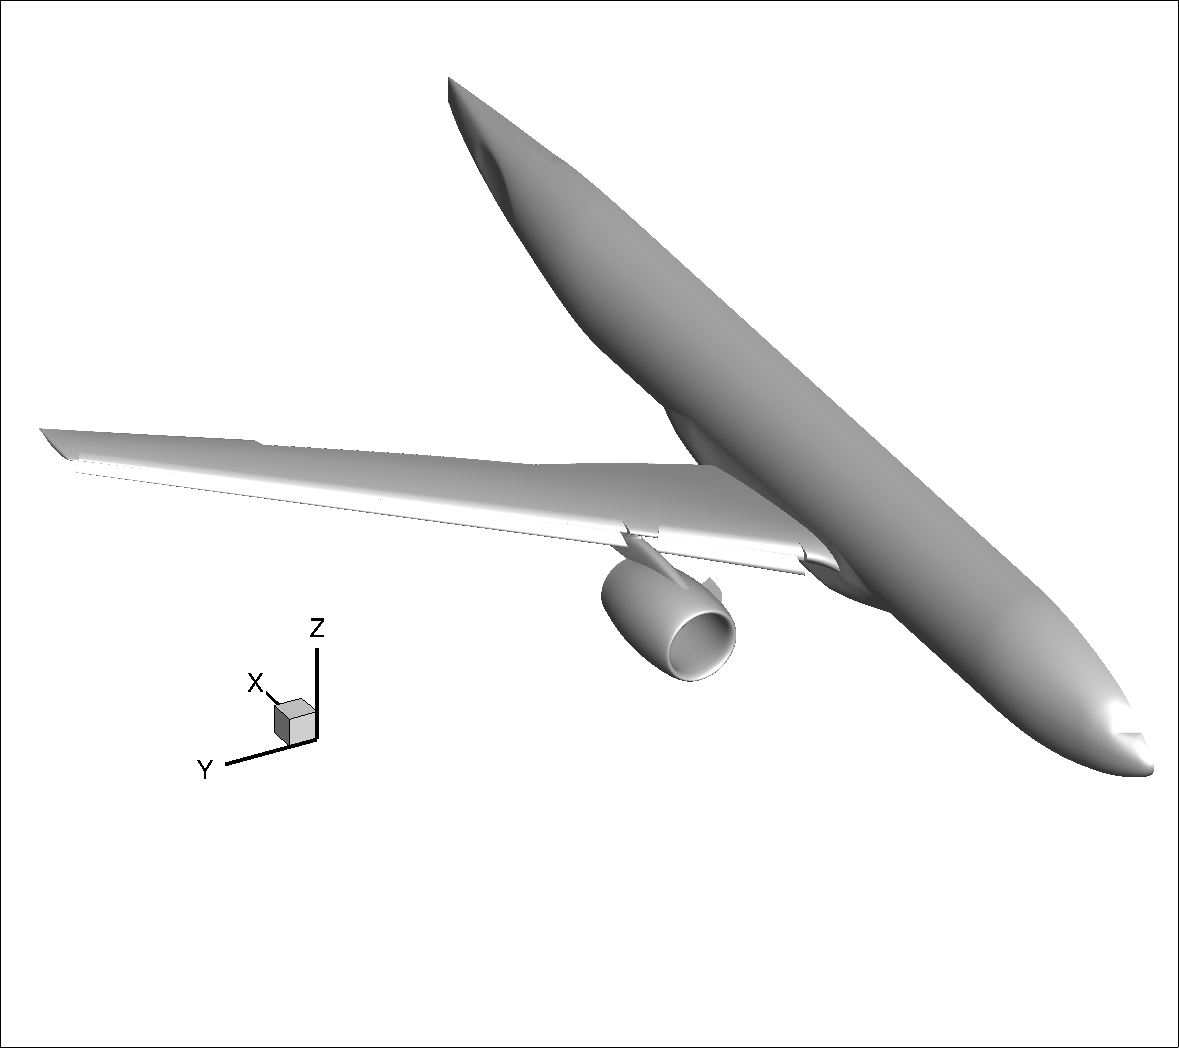
The participants in the HLPW-4 were expected to model an airplane defined by the High Lift Common Research Model (HL-CRM) geometry shown in Figure 1. This geometry consists of a 10% scale model (often half-span) aircraft in high-lift take-off/landing configuration including crucial geometric components such as the slat brackets, flap track fairings, nacelle chine, and junctures between the wing and flaps/slats.

Figure 1: Geometry of HL-CRM model airplane.
Although multiple cases were studied during HLPW-4, our focus is on examining the sensitivity effects for the max CL study, called ‘case 2a’. This case involves varying the angle of attack ⍺ from 2.78° to 21.47° for the nominal flap deflection angles of 40°/37°. The Mach number of the freestream air flow is equal to 0.2 and the freestream Reynolds number based on the mean aerodynamic chord (MAC) length is equal to 5.49 million.
All simulations were performed assuming the airplane is suspended in free-air and not in a wind tunnel where walls or test stands are present. The simulations were run as fully-turbulent without modeling transitional effects.
As a benchmark for the predictions from the CFD simulations, workshop participants were expected to use the experimental data from measurements in the Qinetiq wind tunnel for the integrated loads (both corrected and uncorrected for wall effects), surface pressures and surface oil-flows. A comparison of our CFD results with the latter two observables was included in the workshop submission, but we do not include those results here for brevity.
Mesh Sensitivity
As we mentioned in Part I of this series, one of our main focuses is to study mesh sensitivity effects on CFD solutions. A subset of the cases we modeled are listed in Table 1.
Table 1: The various models simulated for the HLPW-4 workshop.
| Case | Conditions | Meshes | Grid Resolution (nodes) |
|---|---|---|---|
| RANS Mesh Sensitivity - Refinement Study | Full α sweep | ANSA A, B, C | 68M, 138M, 218M |
| RANS Mesh Sensitivity - Topology + Refinement Study | 7.05° | PW Tet A, B, C PW Prism-Tet A, B, C PW Hex-Tet A, B, C |
12M, 32M, 91M 12M, 32M, 91M 12M, 32M, 92M |
| RANS Mesh Sensitivity - Grid Family Study | Full α sweep | PW D v3b ANSA C |
209M 218M |
| RANS Cold-Warm Start Sensitivity | Full α sweep | ANSA C | 218M |
| DES Simulations (SA-DES) | 19.57°, 21.47° | ANSA C | 218M |
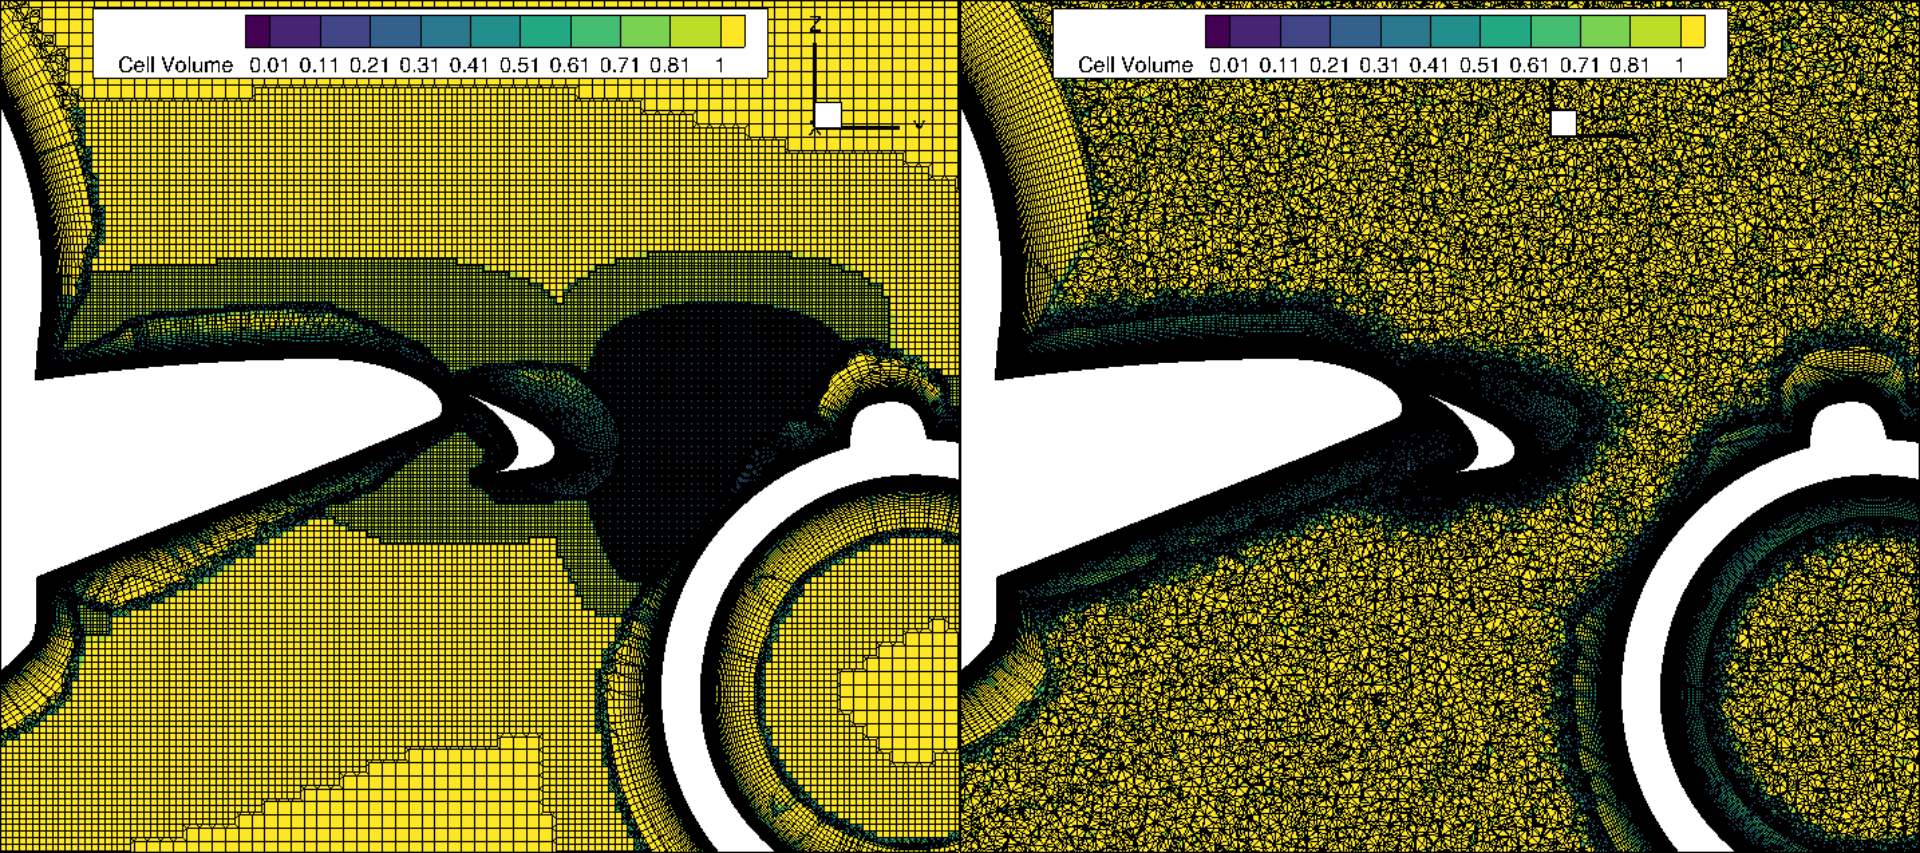
For the mesh sensitivity studies, the types of grid used in the simulations were varied. We used committee-provided unstructured meshes from Pointwise (‘PW’) and from BETA-CAE (labeled as “ANSA” grids); available on the HLPW-4 website. The two types of grids are visualized in Figure 2 at a cross section of the aircraft that includes a portion of the wing root area (on the left), as well as the front portion of the nacelle.

Figure 2: Two types of grids used in our study: ‘ANSA’ on the left and ‘PW’ on the right.
The grid visualizations show that two different strategies are used when generating the grids. The PW mesh has a finer surface grid with consistent off-body refinement, whereas the ANSA grid uses a coarser surface grid with targeted mesh refinement regions. In general, the ANSA grid in our study targets the flow features coming from the nacelle pylon, chine, outer inboard and inner outboard flaps and flap junctions. Furthermore, the surface refinement is propagated downstream over the wing surface, aimed at the preservation of the vortices. The PW grid uses a more uniform surface grid spacing. Furthermore, it uses off-body grid refinement in a more uniform manner, targeting the aircraft wake as a whole rather than individual flow features.
As a part of the grid sensitivity study, the resolution for each type of grid is varied to see if a finer grid resolution leads to better results. The grid resolution range explored for the ANSA grids is from 68 million to 218 million nodes, while, for the PW grid, resolution varied from 12 million to 209 million. For the PW grid, the effect of mesh topology was also investigated by changing the type of basic grid elements consisting of Tetrahedral, Prismatic+Tetrahedral, or Hexahedral+Tetrahedral dominant varieties.
Modeling Sensitivity
In order to check whether the simulations are affected by the initial conditions of the different angles-of-attack, we also carried out simulations with a ‘cold’ or a ‘warm’ start. A cold-started solution is defined as started from free-stream conditions, whereas a warm-started solution is initialized from the previous angle-of-attack solution in the ⍺ sweep.
Additionally, as a final sensitivity check in our study, we also carry out simulations comparing steady-state RANS solutions with transient scale-resolving detached eddy simulations (DES) to study their strengths and weaknesses in this context.
This concludes PART II of the series. In PART III, the final article of the series, we will showcase the results from this suite of simulations.
If you’d like to learn more about CFD simulations, how to optimize them, or how to reduce your simulation time from weeks or days to hours or minutes, stop by our website at Flexcompute.com or follow us on LinkedIn.
For the expanded version of the paper this content is derived from, see An Analysis of Modeling Sensitivity Effects for High Lift Predictions using the Flow360 CFD Solver.


